
Using SXTune
Map Editor
Edit calibration maps, breakpoints and live values using the 2D/3D charts and keyboard tools.
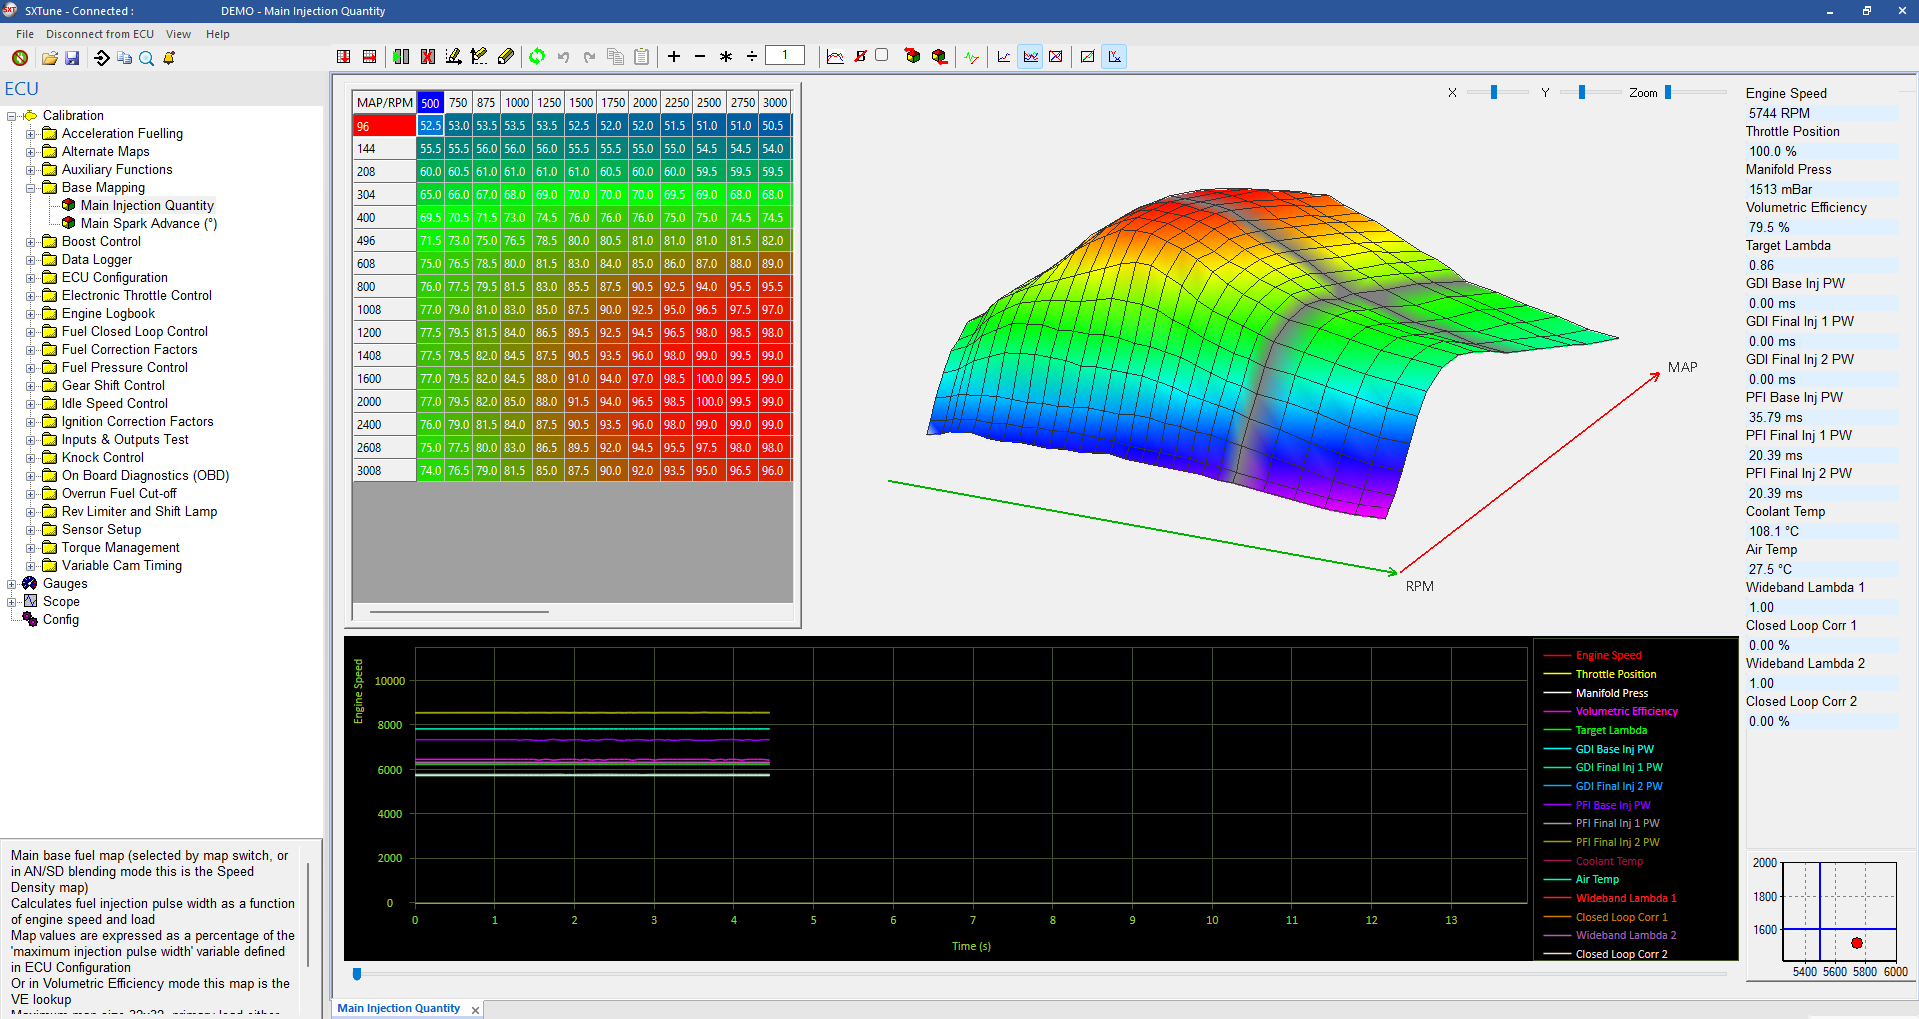
Editing a map
Select cells with the mouse or keyboard. Type a value directly, use PgUp/PgDn for fine changes, or apply the maths operators to the selected cells. Modified cells are shown in bold until cleared or the map changes.
Space jumps the focus to the trace cell. Ctrl+PgUp/Ctrl+PgDn provide coarse adjustment.
2D and 3D chart views
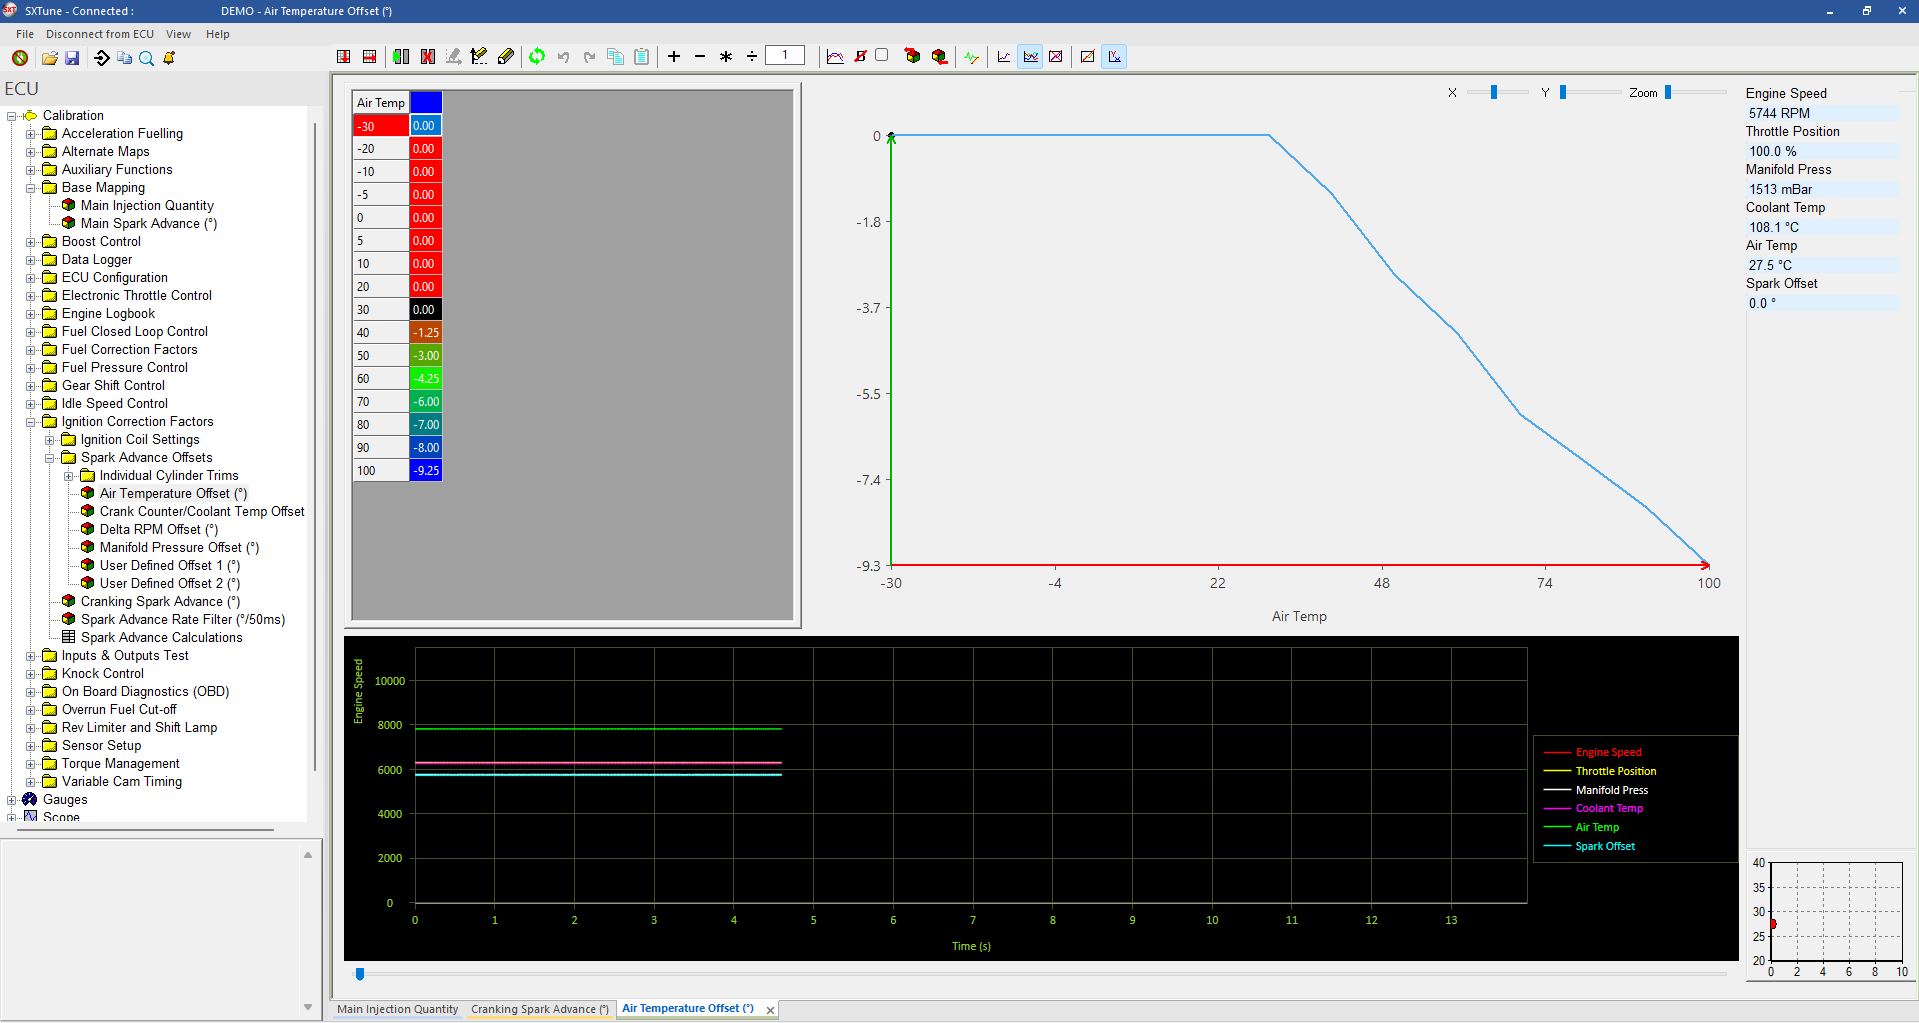
A two-axis table is shown as a 3D surface with a 2D slice below it. A single-axis table is displayed as a 2D chart. The 2D view can cycle through all rows, selected row, all columns and selected column.
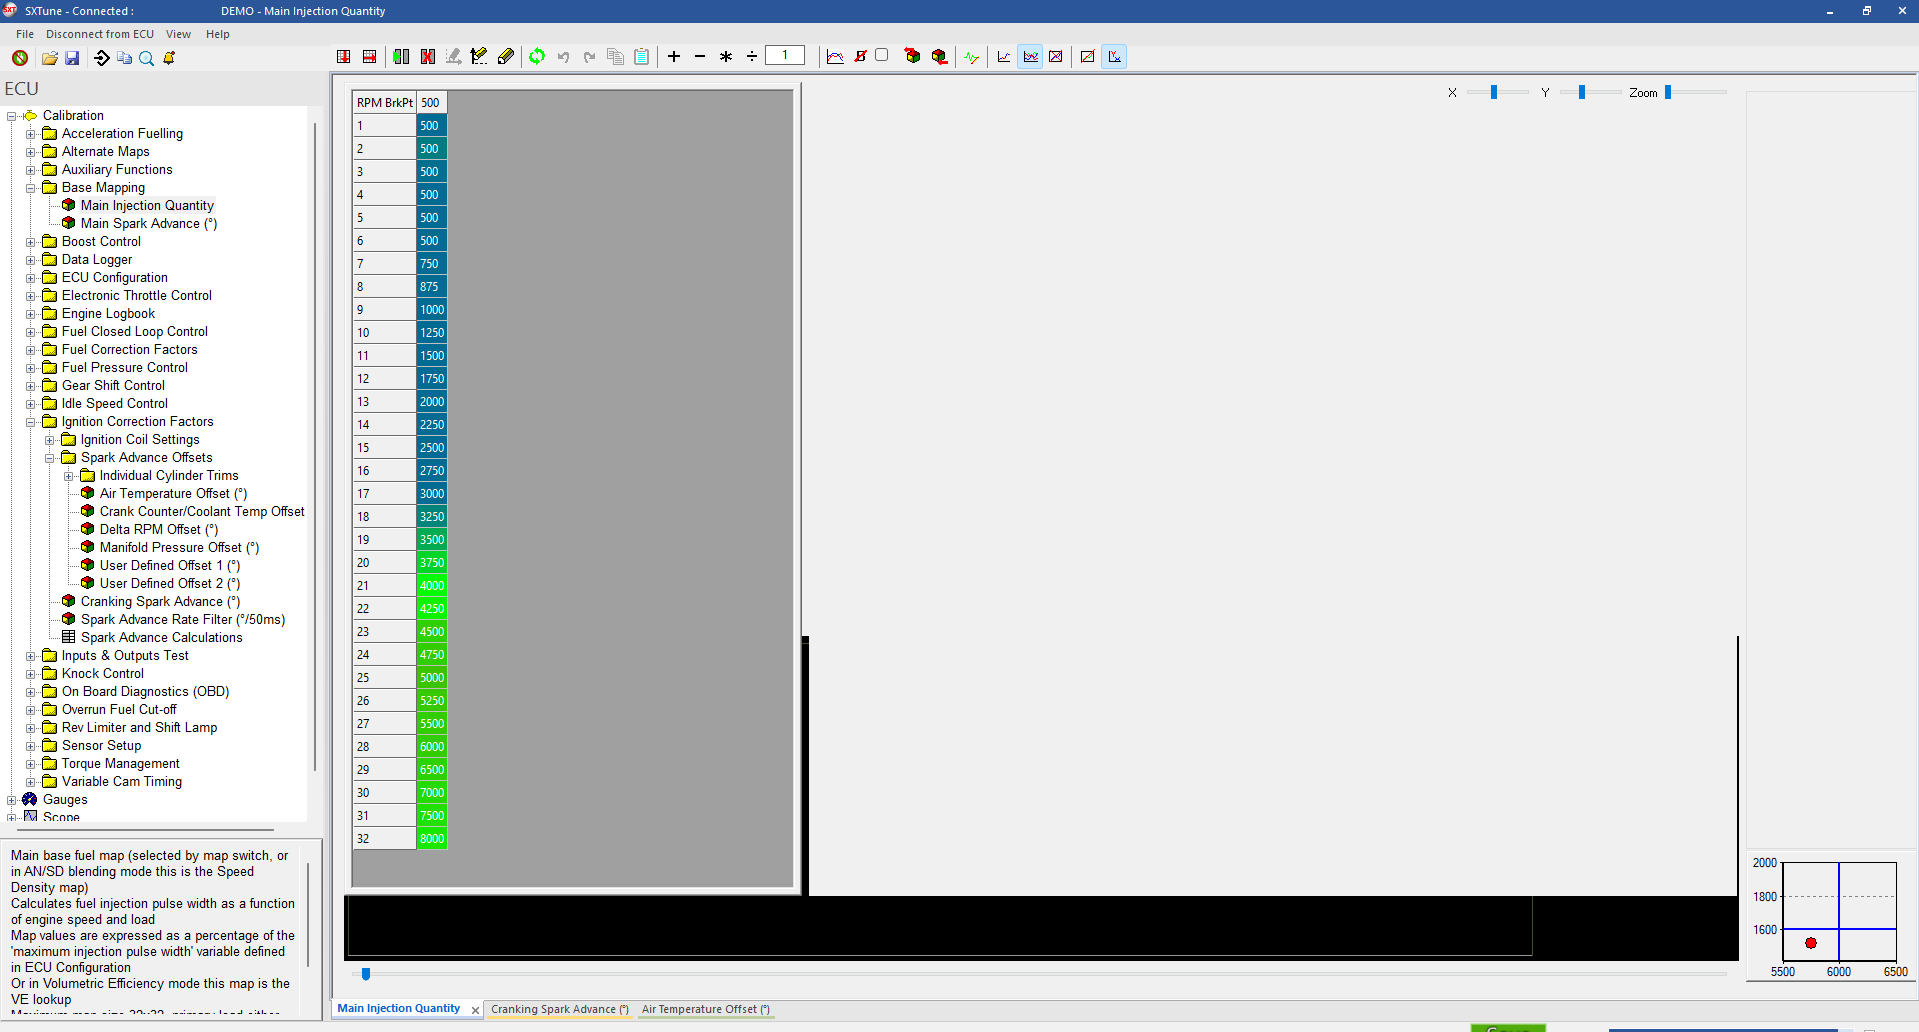
Breakpoint editing
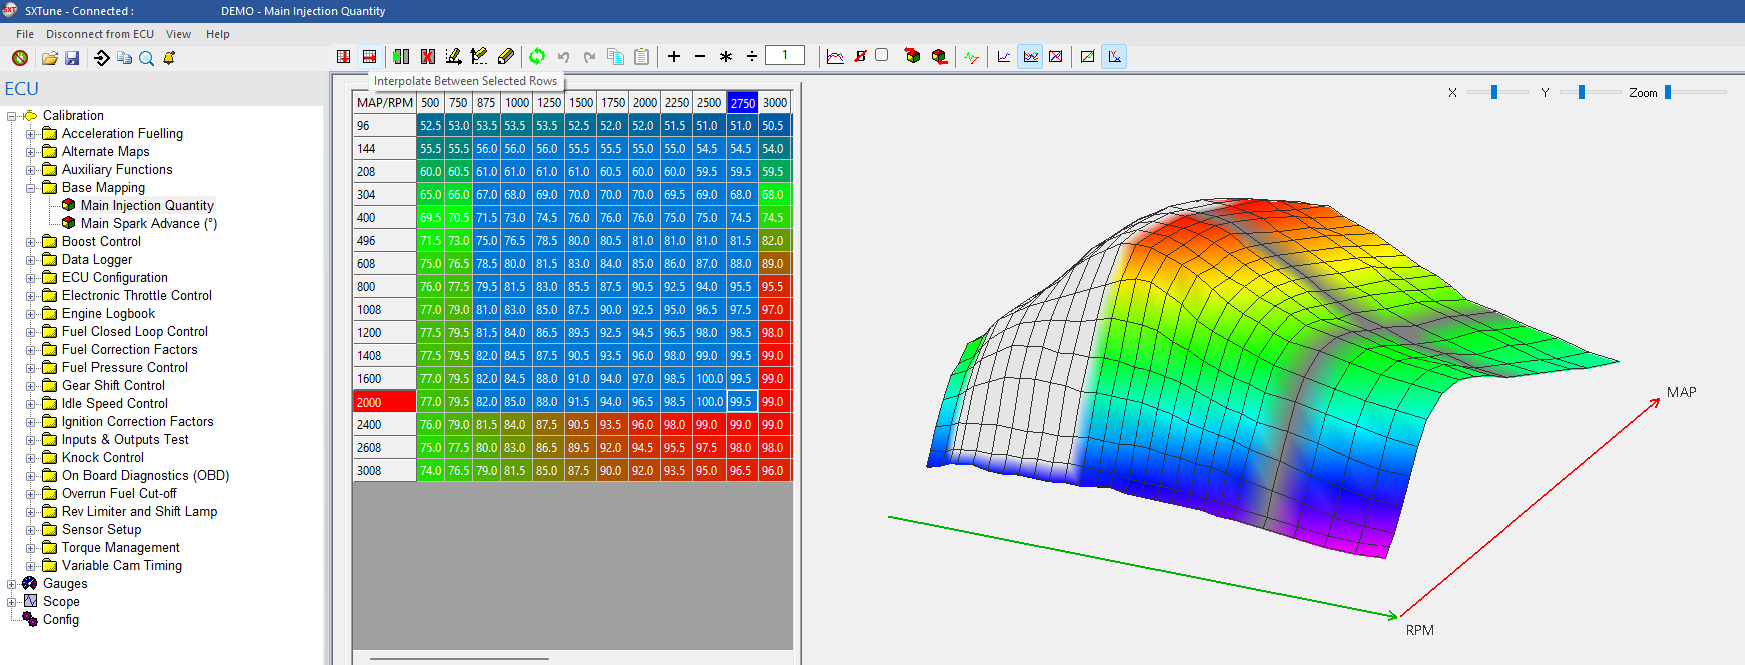
Use F8 for the Y/load axis and F9 for the X/RPM axis; F11 returns to normal map editing. In breakpoint mode the insert/delete breakpoint functions recalculate the table using linear interpolation so the existing calibration shape is preserved as closely as possible.
Quick Fuel
Ctrl+Q applies the live closed-loop fuel correction to the active fuel-map cell when the engine is held at steady state. It requires a working wideband sensor, closed-loop fuelling and a calibrated target lambda map. After applying Quick Fuel, the closed-loop correction at that operating point should move towards zero.
Live data and strip chart
The right-hand live data panel can be customised and the embedded strip chart can record and replay selected channels without leaving the map.