
SXTune Documentation
Engine load calculation
The engine load can be calculated in a few different ways, however for roadcars with emission requirements only the speed density (MAP) or air flow meter (MAF) based volumetric efficiency method should be used to enable a good load detection as a basis for correct fuelling and thus emissions control under all conditions.
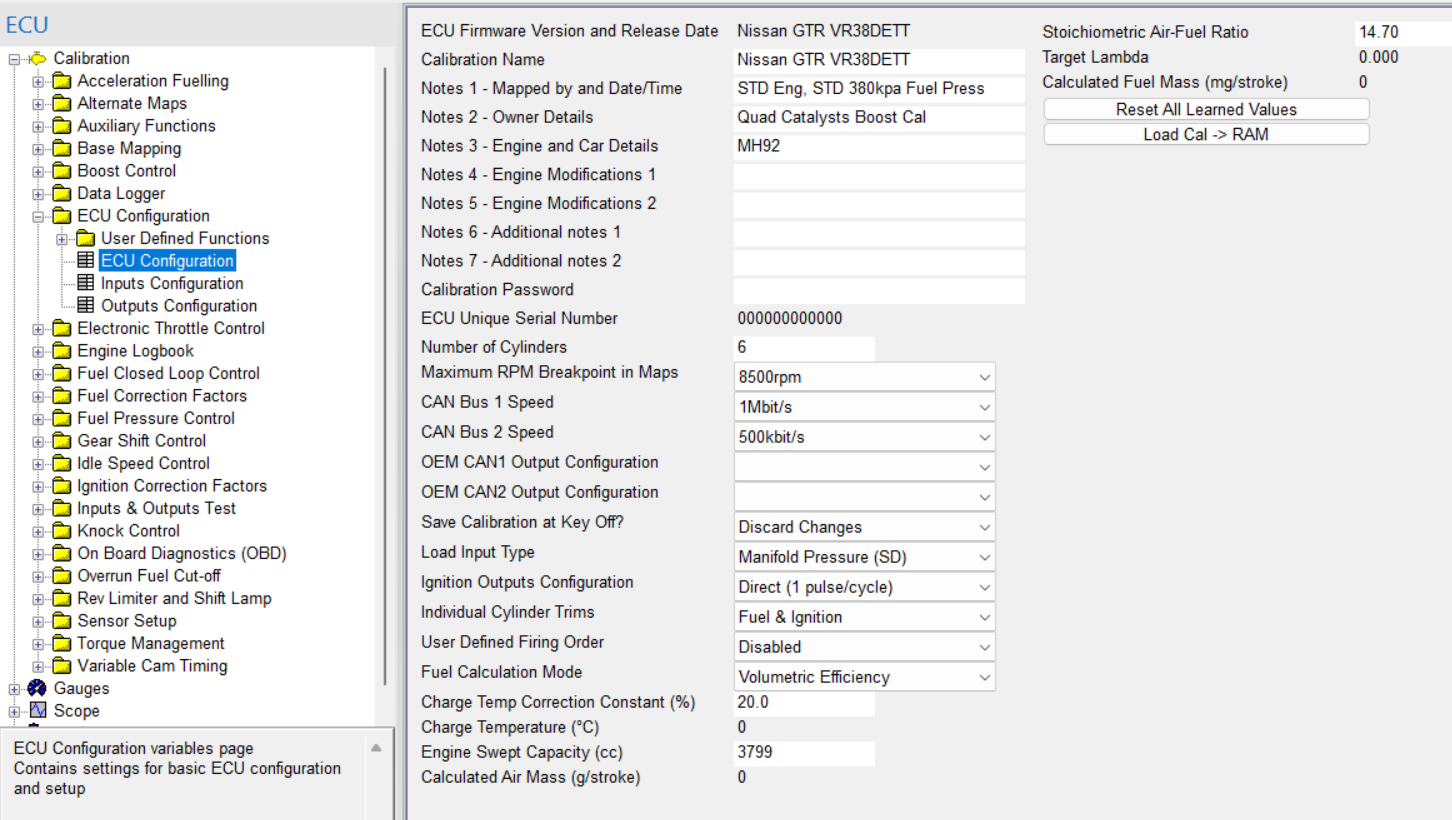
Image: overview table for the ecu configuration as calibrated on the
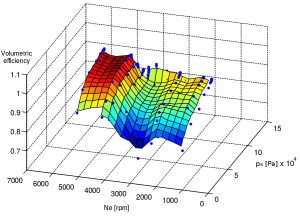
Image: Volumetric efficiency function of intake air pressure and engine speed
The volumetric efficiency of an internal combustion engine depends on several factors like:
the geometry of the intake manifold
the intake air pressure
the intake air temperature
the intake air mass flow rate (which depends on engine speed)
This VE map needs to be calibrated exactly to obtain the required load detection accuracy. We recommend to stay within plusminus 3% under nominal calibration conditions on the nominal engine.
By means of the general gas law we calculate the volume of fresh air going into the engine;
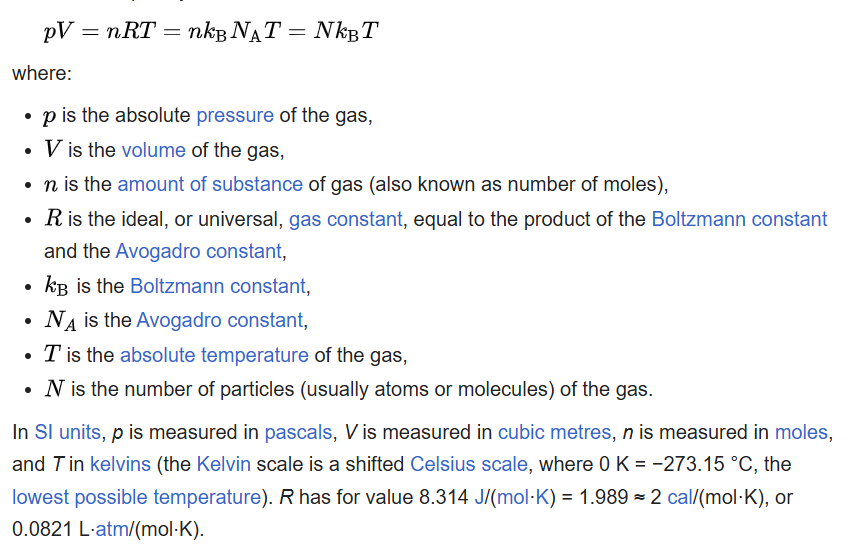
p
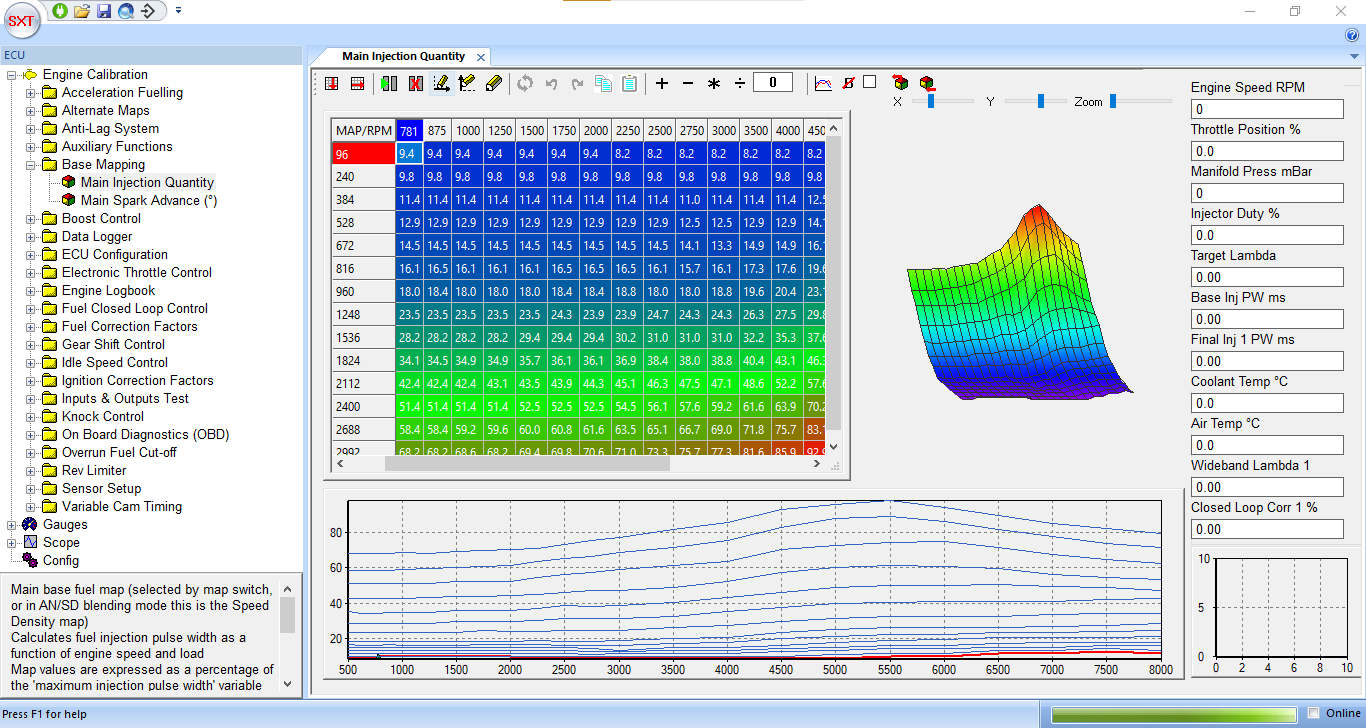
Image: When set to Volumetric efficiency, the main injection quantity map is actually the VE map in function of intake air pressure and engine speed
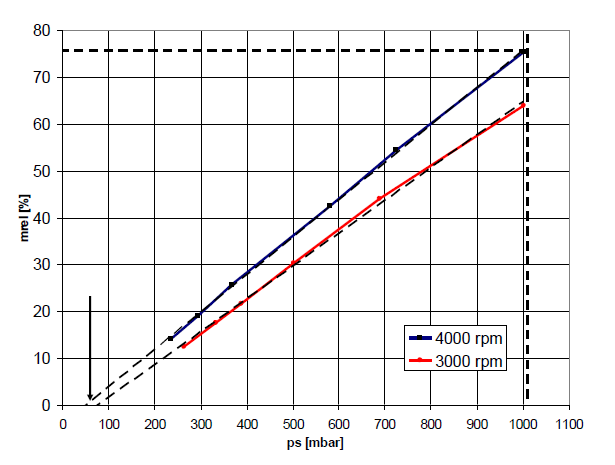
Image: Ignoring the effect of variable valve timing the relationship between intake manifold pressure and airflow is a straight line for each engine speed.
The load axis of the fuel and ignition maps will be either throttle position (TPS) or manifold pressure (MAP) depending on the primary load selection in ECU Configuration.
The load axis breakpoints can be edited by pressing F8 and the engine speed breakpoints can be edited by F9, to return to the map press F11.
When the engine is running, the closest breakpoint to the live load and speed will be indicated by the ‘Trace Cell’ which is highlighted in black.
The proximity to the nearest breakpoint is indicated by a visual representation, the ‘breakpoint proximity control’ in the bottom right hand corner.
To edit the trace cell, press the space bar and the ‘Focus Cell’ (the cell being edited) will jump to the trace cell.
Values can be entered directly by typing in a number, incremented or decremented with Page Up and Page Down or a maths function can be applied using the maths toolbar at the top right hand corner.
Cells that have been edited are highlighted with bold text which is cleared when either the map is changed or the clear bold text icon is clicked.